- On EdTech Newsletter
- Posts
- State of Higher Ed LMS Market for US and Canada: Year-End 2020 Edition
State of Higher Ed LMS Market for US and Canada: Year-End 2020 Edition
Phil Hill
February 04, 2021
It has now been a dozen years of sharing the LMS Market share graphic, commonly known as the squid diagram. With the release of our Year-End 2020 report this week for schools and for vendors / investors, it’s time for us to look at updates on the institutional LMS market for North America (US and Canada) higher education. Note that our coverage for the market analysis includes Europe, Latin America, Oceania (Australia, New Zealand, and surrounding island countries) as well as new coverage of the Middle East.
We present the following data by institutions, with market share as a percentage of the total number of institutions using each LMS as a primary system. Let’s look at an updated LMS market share graphic for US and Canadian higher education. The original idea remains – to give a picture of the LMS market in one page, highlighting the story of the market over time. The key to the graphic is that the width of each band represents the percentage of institutions using a particular LMS as its primary system.
With the current data, Canvas leads with 32% of US & Canadian higher ed institutions, followed by Blackboard at 23%, Moodle at 22%, and D2L at 13%.

In terms of market momentum, Canvas remains the fastest growing LMS over the past year with 51% of new implementations, but D2L’s win rate is catching up at 34%. Blackboard and Moodle are virtually tied, although both are losing market share.
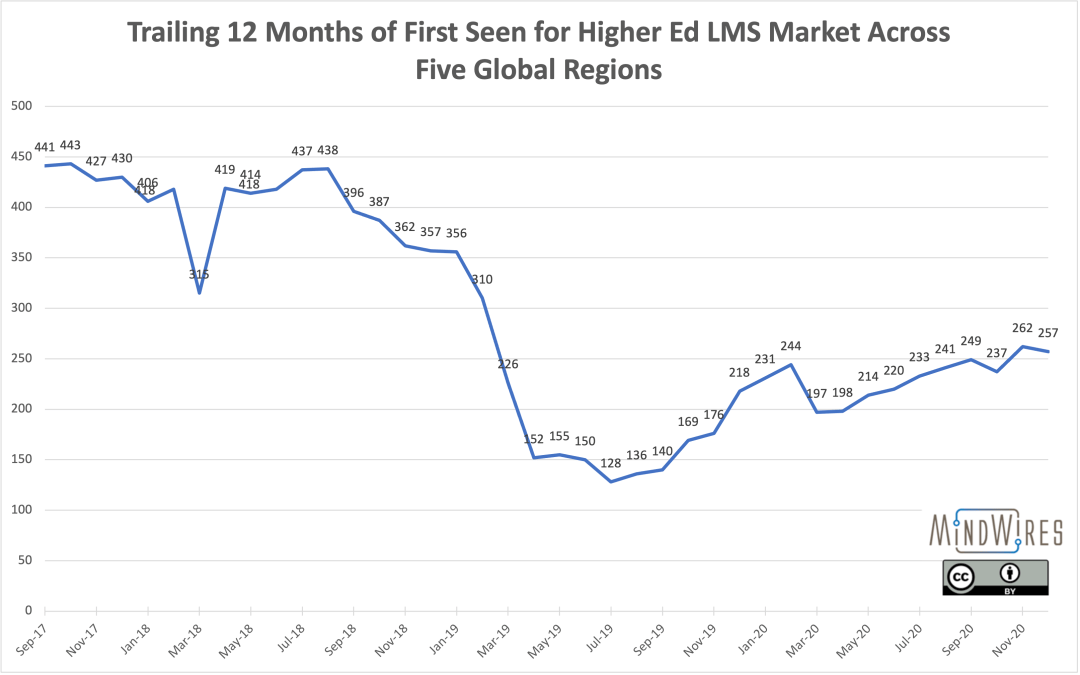
The End of the LMS Market Slowdown
We have described the overall market activity slowdown in that there have been fewer LMS formal evaluations taking place since mid 2018. Based on our 2020 data, however, the LMS market slowdown appears to be over, with a clear trend of increasing market activity. Our latest data show an upward trend in the trailing 12-month First Seen data (which provides more of a leading indicator than New Implementations) across the five global regions we cover.
Disclosure: Instructure, Blackboard, D2L, Moodle, and Schoology are all past or recent subscribers to our LMS Market Analysis service.
The post State of Higher Ed LMS Market for US and Canada: Year-End 2020 Edition appeared first on Phil Hill & Associates.state-of-higher-ed-lms-market-for-us-and-canada-year-end-2020-edition/